About Course
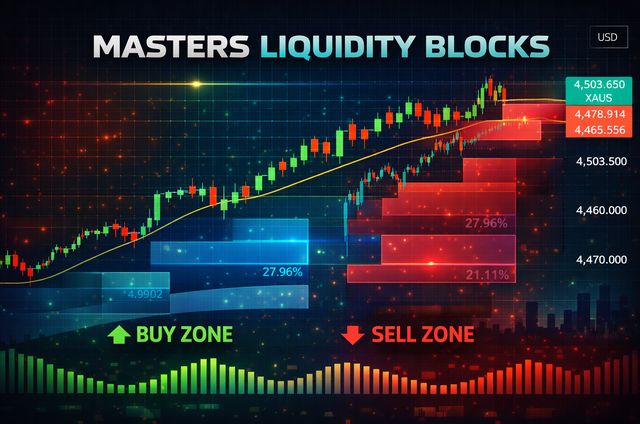
MASTERS LIQUIDITY BLOCKS helps you spot high-impact liquidity zones created during
volatility spikes, and combines that with a higher-timeframe market bias overlay:
1) Volumetric Volatility Blocks (Liquidity Zones)
• Automatically detects volatility spike candles using ATR vs a smoothed ATR (ATR
must exceed SMA(ATR) × multiplier).
• Builds Bullish blocks (when the spike candle closes bullish) and Bearish blocks (when
it closes bearish).
• Draws each block as a range box (high → low) and keeps tracking it forward in time.
• Shows volume + % weight: for the last X blocks, it displays each block’s volume and its
percentage of total volume (so you can see which zones matter most).
• Strength split visualization: each block is split into bullish vs bearish “strength”
portions (based on price movement × volume), so you can quickly judge dominance
inside the zone.
• Overlap protection: avoids stacking blocks on top of each other to keep the chart clean.
• Mitigation logic (Close/Wick): blocks are removed once price “mitigates” them (breaks
through by close or wick, depending on your setting).
• Only shows the last N blocks (configurable) to reduce clutter.
2) Bias Finder (Higher-Timeframe Market Bias)
• Adds a smoothed Heikin-Ashi bias model on a user-selected higher timeframe (non
repainting offsets are included to reduce repainting issues).
• Displays a bullish/bearish bias fill based on an oscillator derived from the smoothed HA
open/close.
• Optional StDev bands to visualize bias expansion/volatility.
_________________________________________________
هذا المؤشر مقدَّم لأغراض تعليمية/معلوماتية فقط ولا يُمثل نصيحة مالية أو توصية بالشراء/البيع.
التداول والأسواق ذات الرافعة (فوركس/عقود فروقات/كريبتو) تنطوي على مخاطر عالية وقد تؤدي إلى خسارة جزئية أو كلية لرأس المال.
الأداء التاريخي أو نتائج الاختبارات الخلفية (Backtesting) هي افتراضية وقد لا تعكس الأداء الحقيقي؛ النتائج قد تختلف بسبب الانزلاق السعري، العمولات، السيولة، وتوقيت الإشارات.
البيانات وأسعار السوق قد تكون متأخرة أو غير دقيقة؛ لا يَضمن المطوّر الدقة أو التوافر أو الخلو من الأخطاء، ولا يتحمل أي مسؤولية عن أي خسائر مباشرة أو غير مباشرة.
يُنصح بشدة باستخدام حساب تجريبي أولًا، وفهم الإعدادات والمخاطر قبل استخدامه على حساب حقيقي. استشر مستشارًا ماليًا مُرخصًا قبل اتخاذ أي قرارات استثمارية.
(اختياري) إذا كان المؤشر يستخدم مصادر متعددة الأطر الزمنية/أساليب قد تُعيد الرسم: قد يُعيد المؤشر الرسم (repaint) في بعض الظروف، ما قد يغيّر الإشارة بعد إغلاق الشمعة.
باستخدامك هذا المؤشر، فأنت توافق على أنه مُقدَّم “كما هو” بدون أي ضمانات صريحة أو ضمنية لملاءمته لأي غرض
Student Ratings & Reviews
